Main Content


GALLERY FEATURED PROPERTIES


ABOUT MEET JULIETTE HOHNEN
Juliette Hohnen is one of The Hollywood Reporter’s “Top 30 Hollywood Real Estate Agents,” specializing in luxury residential real estate in Southern California. A British-born former MTV journalist, Juliette has a diverse clientele that includes musicians, celebrities, entertainment industry professionals, entrepreneurs, and creatives from around the world. Leveraging her extensive network and more than 17 years’ experience selling real estate in Los Angeles, Beverly Hills, Bel Air, Pacific Palisades, Venice, Santa Monica, Hollywood Hills,
Ojai and beyond, she is an expert negotiator and excels at “off-market” deals. In addition to providing all her clients concierge-level white glove service, Juliette utilizes her background in interior design and house flipping to help her sellers maximize sale price and to find properties that make smart investments for her buyers.
-
0 Years
Experience &
Expertise -
Over $0.0
Billion in Career
Sales -
Top 0%
of Real
EstateAgents
Nationwide -
#0 Agent
at Douglas
Elliman Real Estate
in California
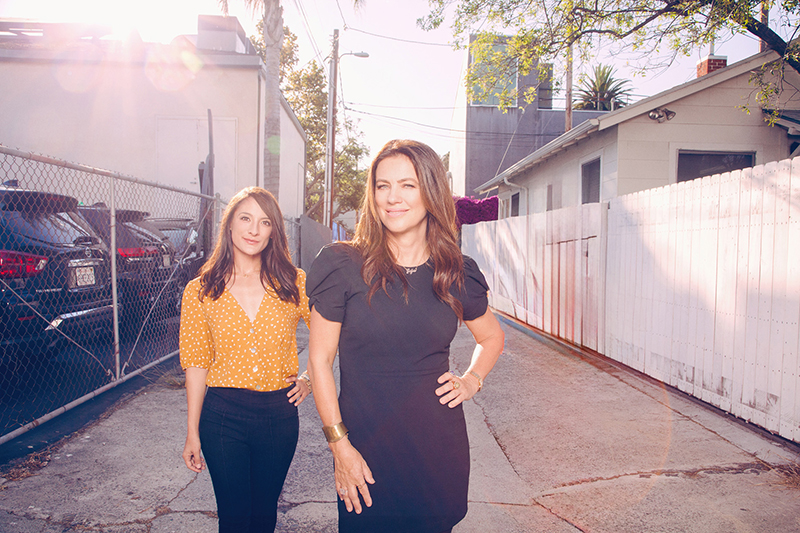
ABOUT MEET THE TEAM
As Juliette's business and sales volume has grown, she has expanded her team to better serve her clients. Juliette carefully selected the members of her team based on their individual specialties and skills so that each person enhances the team with their own areas of focus and expertise. The result is a well-oiled machine that efficiently provides exceptional service to clients and consistently produces impressive results, strengthening Juliette's position as a top real estate agent at Douglas Elliman and in the entire Los Angeles area.
NEIGHBORHOODS EXPLORE THE AREAS WE SERVE


PRESS MEDIA & NEWS

Meet the Former MTV VJ
Who Now Sells
Multimillion-Dollar Homes to
Adele and Emilia Clarke
Social Media INSTAGRAM


